Mon, Feb 2, 2026
[Archive]
Volume 18, Issue 1 (2025)
J Med Edu Dev 2025, 18(1): 32-41 |
Back to browse issues page


Ethics code: IR.ZUMS.REC.1396.35
Download citation:
BibTeX | RIS | EndNote | Medlars | ProCite | Reference Manager | RefWorks
Send citation to:


BibTeX | RIS | EndNote | Medlars | ProCite | Reference Manager | RefWorks
Send citation to:
Nejad-Ebrahim Z, Rasouli A, Tirgari Seraji H, Jahanbakhsh S, Saed O. Insomnia in higher education: Prevalence, validation, and measurement invariance in medical sciences students. J Med Edu Dev 2025; 18 (1) :32-41
URL: http://edujournal.zums.ac.ir/article-1-2195-en.html
URL: http://edujournal.zums.ac.ir/article-1-2195-en.html
Zahra Nejad-Ebrahim1  , Amirhossein Rasouli1 , Hatef Tirgari Seraji2 , Sima Jahanbakhsh3 , Omid Saed *4
, Amirhossein Rasouli1 , Hatef Tirgari Seraji2 , Sima Jahanbakhsh3 , Omid Saed *4
1- Student Research Committee, Department of Clinical Psychology, School of Medicine, Zanjan University of Medical Sciences, Zanjan, Iran
2- Department of Psychology, Faculty of Educational Sciences and Psychology, University of Mohaghegh Ardabili, Ardabil, Iran
3- Student Research Committee, School of Medicine, Zanjan University of Medical Sciences, Zanjan, Iran
4- Department of Clinical Psychology, School of Medicine, Zanjan University of Medical Sciences, Zanjan, Iran ,o.saed@zums.ac.ir
2- Department of Psychology, Faculty of Educational Sciences and Psychology, University of Mohaghegh Ardabili, Ardabil, Iran
3- Student Research Committee, School of Medicine, Zanjan University of Medical Sciences, Zanjan, Iran
4- Department of Clinical Psychology, School of Medicine, Zanjan University of Medical Sciences, Zanjan, Iran ,
Full-Text [PDF 1088 kb]
(596 Downloads)
| Abstract (HTML) (1704 Views)
Full-Text: (373 Views)
Abstract
Background & Objective: Insomnia, a widespread sleep disorder, impacts 15-35% of the general population and a concerning 30% of medical sciences students. This study aims to assesses the psychometric properties, factor structure and measurement invariance of the Insomnia Severity Index (ISI) in Iranian medical university students.
Materials & Methods: This cross-sectional study included 370 medical university students (54.9% females). After providing a detailed introduction regarding the purpose of the study and receiving participants' consent online, they were requested to fill out the Insomnia Severity Index (ISI) and Pittsburgh Sleep Quality Index (PSQI). Confirmatory factor analysis and hierarchical regression analysis were used to examine the factor structure and predict insomnia severity.
Results: The results of descriptive statistics showed that the prevalence of clinical insomnia was 22.6% in male and 27.9% in female students, and 62.2% of male and 67.5% of female students had poor sleep quality. CFA showed that the one-factor model with all items was the most suitable structure (x2 = 13.82, df = 9, GFI = 0.990, CFI = 0.994, TLI = 0.986, RMSEA = 0.038). The study's findings indicate that the ISI exhibits measurement invariance across genders, ensuring its unbiased application for both male and female populations. Furthermore, this scale demonstrated acceptable reliability and validity. Finally, the results of hierarchical regression analysis indicated that the poor sleep quality was a significant predictor of insomnia severity (β = 0.389).
Conclusion: The Persian version of ISI showed strong validity and reliability. These findings indicate that insomnia severity could be measured adequately in Iranian samples using the ISI.
Introduction
Insomnia is a widespread health issue, as it is one of the most commonly reported health complaints and the most common sleep disorder [1]. Sleeping disorders are estimated to affect 15-35% of the general public, and approximately 30% of medical students [2]. A comprehensive analysis of seven studies found that insomnia affects a significant portion of students, with prevalence rates ranging from 9.4% to 38.2% [3]. Moreover, Yassin et al. [4] reported an insomnia prevalence of 18.3% among medical students. Insomnia manifests as a range of sleep disturbances, including difficulty in falling asleep, staying asleep, waking up too early, or experiencing unsatisfactory sleep quality. Additionally, patients diagnosed with insomnia must also report experiencing impairment in their everyday functioning as a outcome of their sleep difficulties [5]. Insomnia disorder is usually accompanied by a wide range of negative health outcomes and elevates the likelihood of developing diverse psychological issues and challenges, including depression and anxiety [6]. Insomnia also significantly impairs academic performance [7]. A cross-sectional study of around 50,000 Norwegian students showed that sleeping less than 5 hours and more than 10 hours, compared to those sleeping 7 to 9 hours, is associated with failing exams [8]. In general, daytime sleepiness, low levels of attention, and impaired memory/decision-making that arise from sleep deprivation can provide a suitable explanation for poor academic performance [9]. Heavy academic workload, professional attitudes and habits, as well as poor awareness of sleep hygiene are among the factors that reduce the duration and quality of sleep, in medical students, consequently leading to their poor academic performance [10].
Given the consequences of insomnia discussed for students, the existence of a instrument to diagnose and assess this disorder in the student population seems necessary. Although polysomnography has emerged as a crucial instrument in the assessment of many sleep disorders, it is not the recommended approach for diagnosing insomnia [5]. Consequently, the diagnosis of insomnia relies primarily on the individual's self-reported experiences and symptoms. While structured and semi-structured clinical interviews are becoming more commonly utilized in clinical settings, these methods are highly time- consuming and necessitate extensive knowledge about sleep disorders. As a result, there is a need for simple and efficient instruments to measure the severity of insomnia in order to facilitate the diagnostic process [11]. The Insomnia Severity Index (ISI) is a self-administered questionnaire that captures two of the most common insomnia complaints: difficulty falling asleep and frequent nighttime awakenings [12]. The ISI, developed in 1993, has emerged as a valuable instrument in both clinical practice and research studies, also the ISI demonstrates validity for use across a broad age range, and it has proven to be a valuable assessment instrument for individuals with diverse conditions, including mantal disorders [13], and other clinical problems [14]. Psychometric evaluations of the ISI have been conducted for the English [15], French [16], Spanish [17], and Chinese [18] versions, and studies have consistently demonstrated the instrument's reliability and adequate concurrent validity with other sleep assessment measures. In Iran, the psychometric characteristics of other tools in the field of sleep, including Pittsburgh Sleep Quality Index [19] and revised Adolescent Sleep Hygiene Scale [20], have been examined. These tools respectively address individuals' perceptions of their sleep quality and sleep hygiene behaviors, but none assess the severity of insomnia. Therefore, the advantage of the ISI is its direct measurement of insomnia severity. However, there is no validation for the Persian version of this questionnaire in the population of Iranian medical sciences students. Hence, the purpose of the present study is to examine the factor structure, psychometric properties, and measurement invariance of the ISI questionnaire in the population of Iranian medical sciences students.
Materials & Methods
Design and setting(s)
This cross-sectional, psychometric study investigated the ISI among Bachelor, Postgraduate, and PhD students at Zanjan University of Medical Sciences, Iran. The Research Ethics Committee of the Zanjan University of Medical Sciences approved the study (Approval ID: IR.ZUMS.REC.1396.35).
Participants and sampling
All participants of this study were Iranian and Persian-speaking, and were selected using convenience sampling. In various studies, different suggestions have been made for determining the appropriate sample size for psychometric studies. These suggestions range from 5 to 20 participants per item [21]. In the present study, 50 participants per item were used. The inclusion criteria for this study included informed consent and an age range of 18 to 50 years. The exclusion criterion was a desire to withdraw from the study or random response to the items.
Tools/Instruments
The following questionnaires were used for data collection, The Insomnia Severity Index (ISI): The ISI is a 7-item questionnaire that measures the severity of insomnia experienced over the past two weeks. It is the most widely used instrument in research for assessing insomnia severity . Each item is rated on a 5-point Likert scale, with scores ranging from 0 to 28. Higher scores indicate greater severity of sleep disturbances and associated daytime symptoms. The ISI's validity and reliability have been confirmed in various studies [22]. The Pittsburgh Sleep Quality Index (PSQI): The PSQI is a self-administered questionnaire, developed by Buysse et al. [23], that assesses sleep quality over the past month. The questionnaire consists of 19 questions/items organized into seven components. Each component is scored from 0 to 3, resulting in a global score ranging from 0 to 21. A global score exceeding 5 indicates poor sleep quality. The PSQI has been validated in various countries and demonstrated good reliability and validity in both clinical and non-clinical samples [24]. In Iran, Shadzi et al. examined the reliability and validity of this questionnaire, among medical students and reporting satisfactory psychometric properties [25].
Data collection methods
To ensure accurate translation, the Persian version of the ISI was prepared in accordance with international guidelines for cross-cultural adaptation of self-report measures [26]. A team of experts, including a clinical psychologist and a psychiatrist, translated the ISI items into Persian. Subsequently, an English language expert conducted a back-translation into English to ensure the accuracy and complete alignment of the Persian and English versions [27]. Following several rounds of review and refinement to address any grammatical or content-related concerns, the translated Persian version of the ISI was finalized and prepared for implementation, maintaining close alignment with the original English instrument. Sampling was conducted through the online posting of brief explanations of the purpose of this research, along with a participation link, on university social media networks. Before completing the scale, participants were provided with informed virtual consent. Following data collection, the responses were screened for validity. Outliers were identified using Mahalanobis distance, and invalid responses were flagged. Invalid responses included fixed and contradictory responses.
Data analysis
The first step in the analysis was to conduct a descriptive analysis of the data to understand the distribution of demographic variables, insomnia severity, and sleep quality in students. this involved frequency distributions and graphical representations were used to visualize the data. To investigate the factor structure of the ISI, CFAs were conducted following an exploratory factor analysis. Three models were tested: a single-factor model with 7 items, a two-factor model with 7 items, and a three-factor model with 7 items. Model fit was assessed using the following indices: chi-square fit statistics (CMIN/DF), incremental fit index (IFI), Tucker-Lewis index (TLI), comparative fit index (CFI), and root mean square error of approximation (RMSEA, 90% CI). goodness of fit was defined as CMIN/DF ≤ 3, TLI, IFI, and CFI ≥ 0.900, and RMSEA ≤ 0.05 [28]. Measurement invariance was employed to assess the degree of invariance between genders (females vs. males). Measurement invariance was assessed to determine the extent to which the ISI exhibits equivalent psychometric properties across genders. This analysis evaluates whether the construct of intrusive thought appraisals is measured in the same way for both genders, ensuring the reliability and validity of comparisons across groups. Measurement invariance was tested using a series of increasingly constrained models including Configural, Metric, and Scalar. Model fit was compared using the change in CFI (ΔCFI) and RMSEA (ΔRMSEA) between the less restrictive and more restrictive models. Cutoff values for acceptable invariance were ΔRSMEA ≤ 0.015 and ΔCFI ≤ 0.01[29]. To assess the questionnaire internal consistency, Cronbach's alpha was calculated. Furthermore, the criterion validity was assessed by examining its correlations with sleep quality measure. The data were analyzed using SPSS version 27 for descriptive statistics, and AMOS version 24 for Confirmatory Factor Analysis (CFA).
Results
As shown in Table 1, a total of 370 students participated in the study, with 45.1% (n = 167) being male and 54.9% (n = 203) being female. The mean age of the participants was 23.79 years (SD = 4.48), with ages ranging from 18 to 51 years. Most participant were single (91.6% of men; 75.4% of women). In terms of educational status, 73.1% of men and 29% of women were postgraduate students. The prevalence of clinical insomnia was 22.6% in men and 27.9% in women. In addition, 37.8% of men and 32.5% of women had good sleep quality.
.JPG)
Table 1. Sociodemographic and clinical variables according to gender
Abbreviations: SD, standard deviation; PSQI, Pittsburgh sleep quality index; n and %, sample size and percentages.
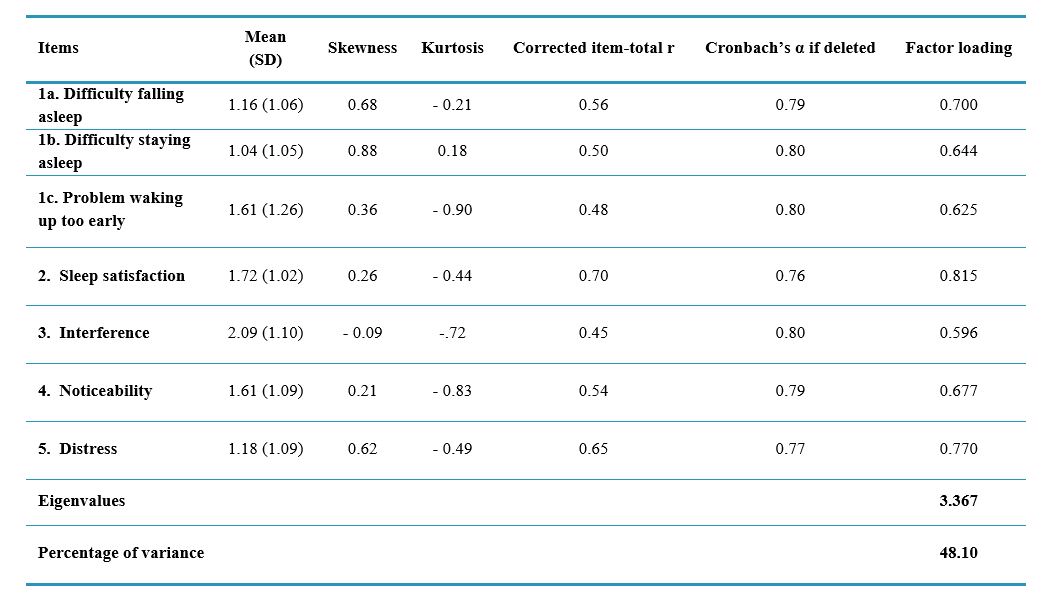
Table 2 displays the mean, standard deviation, skewness, kurtosis, and Cronbach's alpha for the items. the distribution of samples based on the kurtosis and skewness of the items does not exceed the standard range of +2. The corrected item-total correlation indicates a moderate and significant relationship between the items and the total score. The internal consistency coefficients based on Cronbach's alpha did not exceed 0.80 after removing any of the items. Participants responded to all questionnaire items in a nearly uniform manner, and the dispersion was low.
CFA was conducted using Amos version 24. To further assess and validate the factor structures identified in exploratory factor analysis, CFA was performed. The examination of the results showed that the one-factor model exhibited the best and most appropriate fit indices. The results of the CFAs are presented in Table 3. As shown in Table 3, the final full-item model, has the following characteristics x2 = 13.82, df = 9, GFI = 0.990, CFI = 0.994, TLI = 0.986, RMSEA = 0.038. In the final one-factor model, the path coefficients of each item with its underlying factor range from 0.49 to 0.81. This indicates that each item has an acceptable predictive weight with its main factor. Table 2 displays the factor loadings of the items. According to, the factor loading values of the items were above 0.596, ranging from 0.596 in item 3 to 0.815 in item 2.
Table 3 presents the results of the measurement invariance testing for the single-factor model. The model displayed satisfactory fit indices for both males and females, as indicated by the TLI, CFI, and RMSEA. Additionally, the configural, metric, and scalar invariance models tested between gender groups showed satisfactory fit indices based on the TLI, CFI, and RMSEA. Only the configural invariance models exhibited minimal degradation in model fit (Δx2 = 15.428; p = - 0.042; ΔCFI = - 0.012; ΔTLI = - 0.013; ΔRMSEA = 0.007), as well as between the metric and scalar invariance models (Δx2 = 1.954; p= - 0.001; ΔCFI = - 0.001; ΔTLI = - 0.001; ΔRMSEA = < 0.001). Consequently, invariance was established across both genders.
Table 2. Item-Level statistics and factor structure of the ISI (n = 370)
Abbreviations: SD, standard deviation.
Note: The loadings indicate the strength of the relationship between each item and its respective factor. Eigenvalue represents the eigenvalue associated with each factor. Percentage of variance indicates the proportion of variance explained by each factor. Cronbach's alpha value represents the reliability coefficient. Corrected coefficient indicates the Cronbach's alpha value after the removal of each item. skewness and Kurtosis measure the shape of the distribution. M signifies the average response to each item. SD represents the standard deviation of responses.
Table 3. Fit statistics for the confirmatory factor analysis model and Measurement invariance (n = 370)
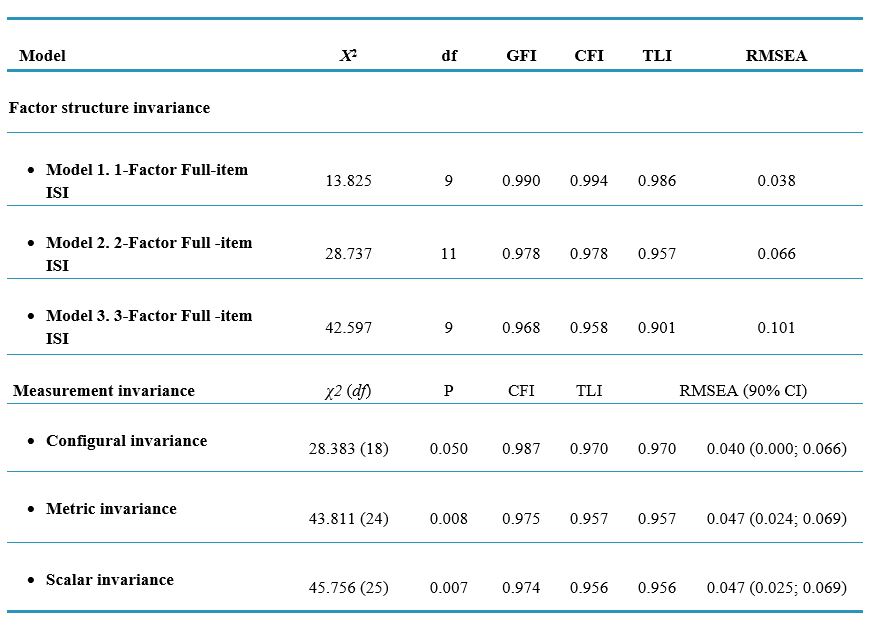
Note: p < 0.05 indicates significance at the 5% level, and p < 0.01 indicates significance at the 1% level.
Abbreviations: X², chi-square statistic; df, degrees of freedom; GFI, goodness of fit index; CFI, comparative fit index; TLI, Tucker-Lewis index; RMSEA, root mean square error of approximation; P, p-value for the chi-square test of invariance; CI, confidence interval.
Convergent validity was assessed using the average variance extracted (AVE) index. An AVE value greater than 0.5 is generally considered acceptable. In the present study, the AVE was estimated to be 0.51. In order to assess Criterion validity of the 7-item ISI, we analyzed the correlation between its total score with other sleep-related scales. The results demonstrate that the relationship between the total score of the ISI with Pittsburgh Sleep Quality Index, show significant correlations, ranging from weak to moderate (r = 0.52 p < 0.01). Internal consistency and composite reliability were used to assess the reliability of the present questionnaire.
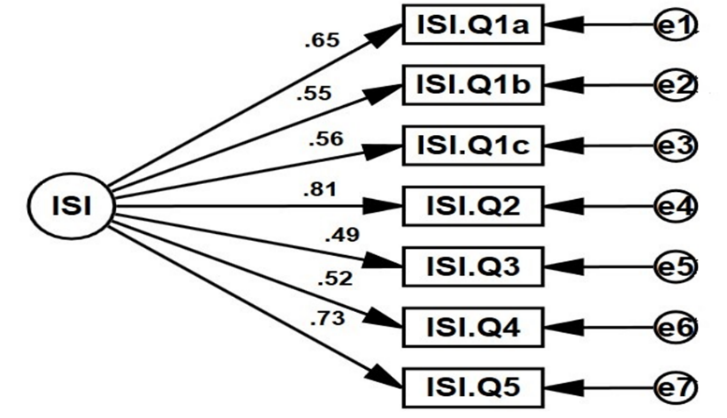
Figure 1. The final model
According to the research findings, the composite reliability (CR) was calculated to be 0.865, and the Cronbach's alpha was 0.813. These results indicate that the questionnaire has adequate reliability in the Iranian population. A hierarchical Multiple regression analysis was conducted to examine the contribution of Sleep Quality in predicting sleep-related problems (Table 4). In this investigation, the severity of insomnia was examined as the result variable, with demographic factors and Sleep Quality serving as predictors. The regression analysis was carried out in a two-step process. In the first step age, gender and marital were entered into the model. The results indicated that none of them can significantly predicted insomnia severity. In the second step, age, gender, marital, and Sleep Quality were entered into the model. The results showed that in this step, only Sleep Quality (β = 0.389) significantly predicted insomnia severity. This suggests that for each 0.389 unit rise in PSQI, revealing of poor sleep quality, there is a corresponding one-unit increase in the severity of insomnia. The R2 value for the regression models in the two steps were 0.006 and 0.395, respectively representing that the final model predicts 38.9% of the insomnia severity.
Table 4. Hierarchical regression model of insomnia severity
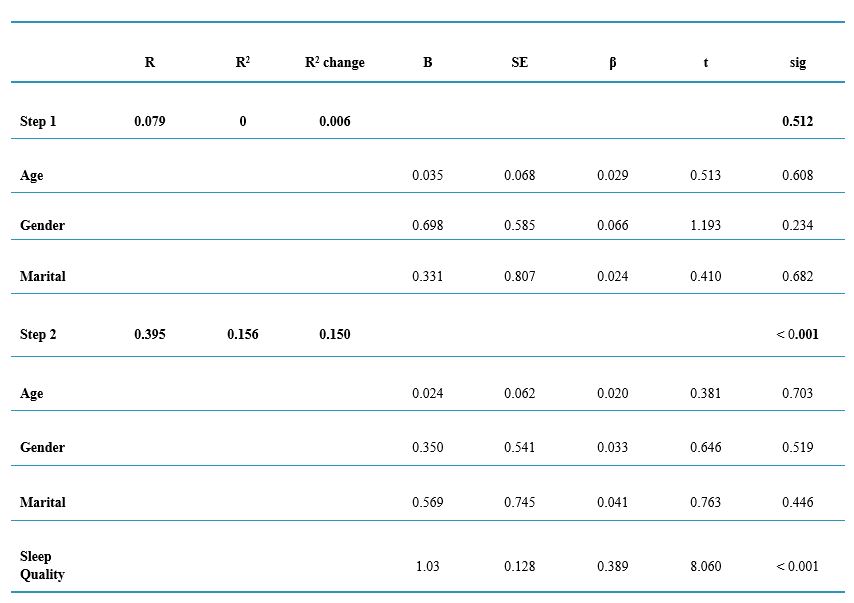
Abbreviations: R, correlation coefficient; R², coefficient of determination; R² change, change in R² when a new variable is added to the model; B, unstandardized regression coefficient; SE, standard error; β, standardized regression coefficient; t, t-statistic; Sig, Significance level.
Discussion
The aim of the present research was to examine the psychometric characteristics, factorial structure, and measurement invariance of the Insomnia Severity Index (ISI) among Iranian medical sciences students. The ISI demonstrated appropriate internal reliability and convergent validity. The findings suggested that the single-factor model proved to be the most suitable model in the student sample, aligning with previous research outcomes.
The current research demonstrates that clinical insomnia affected 22.6% of male students and 27.9% of female students. This outcome aligns with the findings of the meta-analysis study carried out by Zeng et al. [30], which revealed a higher occurrence of insomnia among female students as compared to male students. The explanations for the higher prevalence of insomnia in women, especially female students, seem to be multifactorial
[30]. In general, women tend to be more exposed to unfavorable socioeconomic conditions, such as acquiring lower income or attaining lower educational levels [31], and therefore female students may experience more stress regarding their future and career. Furthermore, women are more likely to face psychiatric problems like depression and anxiety [32], which serve as risk factors for insomnia in women. As a result, female students experience greater emotional dysfunction and report more insomnia.
Furthermore, the results showed that 62.2% of male students and 67.5% of female students had poor sleep quality. In general, caffeine consumption, stress, and irregular sleep-wake patterns can decrease sleep quality, and mental health issues (such as depression, psychiatric disorders, perceived stress, and anxiety) are undoubtedly detrimental to sleep quality [33]. Given that students may stay up late at night and wake up early due to academic demands and social interactions, and tend to sleep more on holidays, their sleep-wake patterns are irregular. Additionally, due to academic and work-related issues,
students experience high levels of stress. Furthermore, during exam periods, students may increase their caffeine consumption to stay more alert and awake. As a result of all these factors, the sleep quality of students decreases. Moreover, the gender differences in sleep quality problems are mainly attributed to the prioritization of emotional disorders and socioeconomic inequalities [34], which lead to higher levels of experienced stress. The susceptibility of women to poor sleep quality may also stem from gender-based differences in sleep biology, which are exacerbated by the higher levels of emotional disorders in women [35]. Therefore, all of these factors synergistically contribute to a greater reduction in the sleep quality of female students compared to male students.
The findings indicated that the ISI is a reliable instrument for assessing the severity of insomnia in the Iranian medical student population. Specifically, the results demonstrating the good internal consistency of this scale are consistent with the findings from previous research [36]. In this study, three models were tested: one, two, and three-factor model (without item deletion). The results of the CFA indicated that the one-factor model was the most appropriate model for the Iranian medical sciences student population, accounting for 48.10% of the total variance of the questionnaire. This finding is consistent with the results of studies in Sweden [37], and the United States [36], but inconsistent with other studies (11, 38). In explaining this finding, it can be said that in the present study, the two-factor and three-factor models were also fairly suitable, but the one-factor model was the best and most appropriate model for explaining the Insomnia Severity Index in the Iranian medical student population. Additionally, the linguistic and cultural differences between the Iranian population and the populations of other studies can be mentioned.
The measurement invariance implies that the ISI can be utilized in a sufficiently unbiased manner among both male and female respondents. Putnick and Bornstein [39] have suggested that scalar measurement invariance analyses serve as dynamic and informative evaluations of a construct's functioning across groups, rather than serving as gateway tests. These results contribute to the growing body of literature on the psychometric robustness of the ISI and underscore its cross-gender applicability. Furthermore, the results indicated that the Persian version of the ISI (ISI-P) had satisfactory convergent validity (significant positive correlation) with the sleep quality measurement instrument, r = 0.52, p < 0.001. This psychometric property is aligns with the findings of previous studies [17].
The results of the hierarchical regression analysis point to the predictive role of sleep quality in the severity of insomnia (β= 0.389). This indicates that sleep quality accounts for 38.9% of the variance in insomnia severity. The PSQI, used in our study to measure sleep quality, has been widely validated and shown to be effective in assessing various dimensions of sleep quality, including subjective sleep quality, sleep duration, sleep latency, sleep disturbances, habitual sleep efficiency, and daytime dysfunction [23]. Poor scores on these dimensions were significantly correlated with higher ISI scores, indicating more severe insomnia. This is align with previous studies that have found a strong relationship between sleep quality, as measured by the PSQI, and insomnia severity [40].
In examining the broader implications of these findings, it is essential to consider the multifaceted nature of sleep quality and its determinants. Factors such as sleep hygiene, psychological stress, academic workload, and lifestyle habits can significantly influence sleep quality. In other words, practices that compromise good sleep hygiene, such as extensive screen usage before bed, inconsistent sleep schedules, and excessive caffeine intake, can worsen sleep quality and heighten the risk of developing insomnia [41]. Moreover, psychological factors play a critical role in sleep quality. There is a strong connection between stress, anxiety, and depression, as well as poor sleep quality and insomnia. Research has found that people with higher stress levels and negative affect are more prone to experiencing poor sleep quality and, in turn, developing more pronounced insomnia [15]. The interplay between psychological factors and sleep quality suggests that interventions aimed at reducing stress and improving mental health could be effective in mitigating insomnia severity.
This study had a few limitations such as did not controling for medication treatment in the sample data. Future studies can address this factor. The convergent validity of the ISI-P scale was assessed using only one measurement instrument. The study relied on a single source of data (self-report) for evaluating insomnia severity. Future research could consider incorporating additional measures, such as sleep diaries or objective sleep assessments, to provide a more comprehensive evaluation. Despite these limitations, the findings contribute to the growing body of evidence supporting the psychometric properties of the ISI in the Iranian medical student population.
Conclusion
In this study, the cross-cultural adaptation of the Insomnia Severity Index (ISI) was rigorously conducted in accordance with established guidelines, and its factor structure, psychometric properties and measurement invariance were examined in a sample of Iranian medical sciences students. The results of this study strengthen the psychometric validity of the ISI and further reinforce its structural validity. Additionally, the results of the regression analysis showed that sleep quality is the best predictor of insomnia severity. Overall, the findings of this study can facilitate future research and clinical interventions related to the severity of insomnia. However, further studies are needed to deepen our understanding of insomnia severity and its relationship with other variables that impact individual functioning.
Ethical considerations
The Research Ethics Committee of the Zanjan University of Medical Sciences (ZUMS), in Zanjan, Iran approved the study (Approval ID: IR.ZUMS.REC.1402.176). All participants gave written informed consent, and they could withdraw from the study at any stage.
Artificial intelligence utilization for article writing
The authors declare that they did not use generative Artificial Intelligence (AI) and AI-assisted technologies in the writing process of this paper.
Acknowledgments
The authors want to thank all students of Zanjan University of Medical Sciences (Iran) who actively participated in this study.
Conflict of interest statement
The authors have no conflicts of interest to declare
Author contributions
ZNE, AR and OS and designed, conducted the study, performed the statistical analyses, and wrote the manuscript. HTS participated in the design and coordination and helped to draft the manuscript. All authors read and approved the final manuscript
Funding
Zanjan University of Medical Sciences has financially supported this study.
Data availability statement
Data will be made available on request.
Background & Objective: Insomnia, a widespread sleep disorder, impacts 15-35% of the general population and a concerning 30% of medical sciences students. This study aims to assesses the psychometric properties, factor structure and measurement invariance of the Insomnia Severity Index (ISI) in Iranian medical university students.
Materials & Methods: This cross-sectional study included 370 medical university students (54.9% females). After providing a detailed introduction regarding the purpose of the study and receiving participants' consent online, they were requested to fill out the Insomnia Severity Index (ISI) and Pittsburgh Sleep Quality Index (PSQI). Confirmatory factor analysis and hierarchical regression analysis were used to examine the factor structure and predict insomnia severity.
Results: The results of descriptive statistics showed that the prevalence of clinical insomnia was 22.6% in male and 27.9% in female students, and 62.2% of male and 67.5% of female students had poor sleep quality. CFA showed that the one-factor model with all items was the most suitable structure (x2 = 13.82, df = 9, GFI = 0.990, CFI = 0.994, TLI = 0.986, RMSEA = 0.038). The study's findings indicate that the ISI exhibits measurement invariance across genders, ensuring its unbiased application for both male and female populations. Furthermore, this scale demonstrated acceptable reliability and validity. Finally, the results of hierarchical regression analysis indicated that the poor sleep quality was a significant predictor of insomnia severity (β = 0.389).
Conclusion: The Persian version of ISI showed strong validity and reliability. These findings indicate that insomnia severity could be measured adequately in Iranian samples using the ISI.
Introduction
Insomnia is a widespread health issue, as it is one of the most commonly reported health complaints and the most common sleep disorder [1]. Sleeping disorders are estimated to affect 15-35% of the general public, and approximately 30% of medical students [2]. A comprehensive analysis of seven studies found that insomnia affects a significant portion of students, with prevalence rates ranging from 9.4% to 38.2% [3]. Moreover, Yassin et al. [4] reported an insomnia prevalence of 18.3% among medical students. Insomnia manifests as a range of sleep disturbances, including difficulty in falling asleep, staying asleep, waking up too early, or experiencing unsatisfactory sleep quality. Additionally, patients diagnosed with insomnia must also report experiencing impairment in their everyday functioning as a outcome of their sleep difficulties [5]. Insomnia disorder is usually accompanied by a wide range of negative health outcomes and elevates the likelihood of developing diverse psychological issues and challenges, including depression and anxiety [6]. Insomnia also significantly impairs academic performance [7]. A cross-sectional study of around 50,000 Norwegian students showed that sleeping less than 5 hours and more than 10 hours, compared to those sleeping 7 to 9 hours, is associated with failing exams [8]. In general, daytime sleepiness, low levels of attention, and impaired memory/decision-making that arise from sleep deprivation can provide a suitable explanation for poor academic performance [9]. Heavy academic workload, professional attitudes and habits, as well as poor awareness of sleep hygiene are among the factors that reduce the duration and quality of sleep, in medical students, consequently leading to their poor academic performance [10].
Given the consequences of insomnia discussed for students, the existence of a instrument to diagnose and assess this disorder in the student population seems necessary. Although polysomnography has emerged as a crucial instrument in the assessment of many sleep disorders, it is not the recommended approach for diagnosing insomnia [5]. Consequently, the diagnosis of insomnia relies primarily on the individual's self-reported experiences and symptoms. While structured and semi-structured clinical interviews are becoming more commonly utilized in clinical settings, these methods are highly time- consuming and necessitate extensive knowledge about sleep disorders. As a result, there is a need for simple and efficient instruments to measure the severity of insomnia in order to facilitate the diagnostic process [11]. The Insomnia Severity Index (ISI) is a self-administered questionnaire that captures two of the most common insomnia complaints: difficulty falling asleep and frequent nighttime awakenings [12]. The ISI, developed in 1993, has emerged as a valuable instrument in both clinical practice and research studies, also the ISI demonstrates validity for use across a broad age range, and it has proven to be a valuable assessment instrument for individuals with diverse conditions, including mantal disorders [13], and other clinical problems [14]. Psychometric evaluations of the ISI have been conducted for the English [15], French [16], Spanish [17], and Chinese [18] versions, and studies have consistently demonstrated the instrument's reliability and adequate concurrent validity with other sleep assessment measures. In Iran, the psychometric characteristics of other tools in the field of sleep, including Pittsburgh Sleep Quality Index [19] and revised Adolescent Sleep Hygiene Scale [20], have been examined. These tools respectively address individuals' perceptions of their sleep quality and sleep hygiene behaviors, but none assess the severity of insomnia. Therefore, the advantage of the ISI is its direct measurement of insomnia severity. However, there is no validation for the Persian version of this questionnaire in the population of Iranian medical sciences students. Hence, the purpose of the present study is to examine the factor structure, psychometric properties, and measurement invariance of the ISI questionnaire in the population of Iranian medical sciences students.
Materials & Methods
Design and setting(s)
This cross-sectional, psychometric study investigated the ISI among Bachelor, Postgraduate, and PhD students at Zanjan University of Medical Sciences, Iran. The Research Ethics Committee of the Zanjan University of Medical Sciences approved the study (Approval ID: IR.ZUMS.REC.1396.35).
Participants and sampling
All participants of this study were Iranian and Persian-speaking, and were selected using convenience sampling. In various studies, different suggestions have been made for determining the appropriate sample size for psychometric studies. These suggestions range from 5 to 20 participants per item [21]. In the present study, 50 participants per item were used. The inclusion criteria for this study included informed consent and an age range of 18 to 50 years. The exclusion criterion was a desire to withdraw from the study or random response to the items.
Tools/Instruments
The following questionnaires were used for data collection, The Insomnia Severity Index (ISI): The ISI is a 7-item questionnaire that measures the severity of insomnia experienced over the past two weeks. It is the most widely used instrument in research for assessing insomnia severity . Each item is rated on a 5-point Likert scale, with scores ranging from 0 to 28. Higher scores indicate greater severity of sleep disturbances and associated daytime symptoms. The ISI's validity and reliability have been confirmed in various studies [22]. The Pittsburgh Sleep Quality Index (PSQI): The PSQI is a self-administered questionnaire, developed by Buysse et al. [23], that assesses sleep quality over the past month. The questionnaire consists of 19 questions/items organized into seven components. Each component is scored from 0 to 3, resulting in a global score ranging from 0 to 21. A global score exceeding 5 indicates poor sleep quality. The PSQI has been validated in various countries and demonstrated good reliability and validity in both clinical and non-clinical samples [24]. In Iran, Shadzi et al. examined the reliability and validity of this questionnaire, among medical students and reporting satisfactory psychometric properties [25].
Data collection methods
To ensure accurate translation, the Persian version of the ISI was prepared in accordance with international guidelines for cross-cultural adaptation of self-report measures [26]. A team of experts, including a clinical psychologist and a psychiatrist, translated the ISI items into Persian. Subsequently, an English language expert conducted a back-translation into English to ensure the accuracy and complete alignment of the Persian and English versions [27]. Following several rounds of review and refinement to address any grammatical or content-related concerns, the translated Persian version of the ISI was finalized and prepared for implementation, maintaining close alignment with the original English instrument. Sampling was conducted through the online posting of brief explanations of the purpose of this research, along with a participation link, on university social media networks. Before completing the scale, participants were provided with informed virtual consent. Following data collection, the responses were screened for validity. Outliers were identified using Mahalanobis distance, and invalid responses were flagged. Invalid responses included fixed and contradictory responses.
Data analysis
The first step in the analysis was to conduct a descriptive analysis of the data to understand the distribution of demographic variables, insomnia severity, and sleep quality in students. this involved frequency distributions and graphical representations were used to visualize the data. To investigate the factor structure of the ISI, CFAs were conducted following an exploratory factor analysis. Three models were tested: a single-factor model with 7 items, a two-factor model with 7 items, and a three-factor model with 7 items. Model fit was assessed using the following indices: chi-square fit statistics (CMIN/DF), incremental fit index (IFI), Tucker-Lewis index (TLI), comparative fit index (CFI), and root mean square error of approximation (RMSEA, 90% CI). goodness of fit was defined as CMIN/DF ≤ 3, TLI, IFI, and CFI ≥ 0.900, and RMSEA ≤ 0.05 [28]. Measurement invariance was employed to assess the degree of invariance between genders (females vs. males). Measurement invariance was assessed to determine the extent to which the ISI exhibits equivalent psychometric properties across genders. This analysis evaluates whether the construct of intrusive thought appraisals is measured in the same way for both genders, ensuring the reliability and validity of comparisons across groups. Measurement invariance was tested using a series of increasingly constrained models including Configural, Metric, and Scalar. Model fit was compared using the change in CFI (ΔCFI) and RMSEA (ΔRMSEA) between the less restrictive and more restrictive models. Cutoff values for acceptable invariance were ΔRSMEA ≤ 0.015 and ΔCFI ≤ 0.01[29]. To assess the questionnaire internal consistency, Cronbach's alpha was calculated. Furthermore, the criterion validity was assessed by examining its correlations with sleep quality measure. The data were analyzed using SPSS version 27 for descriptive statistics, and AMOS version 24 for Confirmatory Factor Analysis (CFA).
Results
As shown in Table 1, a total of 370 students participated in the study, with 45.1% (n = 167) being male and 54.9% (n = 203) being female. The mean age of the participants was 23.79 years (SD = 4.48), with ages ranging from 18 to 51 years. Most participant were single (91.6% of men; 75.4% of women). In terms of educational status, 73.1% of men and 29% of women were postgraduate students. The prevalence of clinical insomnia was 22.6% in men and 27.9% in women. In addition, 37.8% of men and 32.5% of women had good sleep quality.
Table 1. Sociodemographic and clinical variables according to gender
Abbreviations: SD, standard deviation; PSQI, Pittsburgh sleep quality index; n and %, sample size and percentages.
Table 2 displays the mean, standard deviation, skewness, kurtosis, and Cronbach's alpha for the items. the distribution of samples based on the kurtosis and skewness of the items does not exceed the standard range of +2. The corrected item-total correlation indicates a moderate and significant relationship between the items and the total score. The internal consistency coefficients based on Cronbach's alpha did not exceed 0.80 after removing any of the items. Participants responded to all questionnaire items in a nearly uniform manner, and the dispersion was low.
CFA was conducted using Amos version 24. To further assess and validate the factor structures identified in exploratory factor analysis, CFA was performed. The examination of the results showed that the one-factor model exhibited the best and most appropriate fit indices. The results of the CFAs are presented in Table 3. As shown in Table 3, the final full-item model, has the following characteristics x2 = 13.82, df = 9, GFI = 0.990, CFI = 0.994, TLI = 0.986, RMSEA = 0.038. In the final one-factor model, the path coefficients of each item with its underlying factor range from 0.49 to 0.81. This indicates that each item has an acceptable predictive weight with its main factor. Table 2 displays the factor loadings of the items. According to, the factor loading values of the items were above 0.596, ranging from 0.596 in item 3 to 0.815 in item 2.
Table 3 presents the results of the measurement invariance testing for the single-factor model. The model displayed satisfactory fit indices for both males and females, as indicated by the TLI, CFI, and RMSEA. Additionally, the configural, metric, and scalar invariance models tested between gender groups showed satisfactory fit indices based on the TLI, CFI, and RMSEA. Only the configural invariance models exhibited minimal degradation in model fit (Δx2 = 15.428; p = - 0.042; ΔCFI = - 0.012; ΔTLI = - 0.013; ΔRMSEA = 0.007), as well as between the metric and scalar invariance models (Δx2 = 1.954; p= - 0.001; ΔCFI = - 0.001; ΔTLI = - 0.001; ΔRMSEA = < 0.001). Consequently, invariance was established across both genders.
Table 2. Item-Level statistics and factor structure of the ISI (n = 370)
Abbreviations: SD, standard deviation.
Note: The loadings indicate the strength of the relationship between each item and its respective factor. Eigenvalue represents the eigenvalue associated with each factor. Percentage of variance indicates the proportion of variance explained by each factor. Cronbach's alpha value represents the reliability coefficient. Corrected coefficient indicates the Cronbach's alpha value after the removal of each item. skewness and Kurtosis measure the shape of the distribution. M signifies the average response to each item. SD represents the standard deviation of responses.
Table 3. Fit statistics for the confirmatory factor analysis model and Measurement invariance (n = 370)
Note: p < 0.05 indicates significance at the 5% level, and p < 0.01 indicates significance at the 1% level.
Abbreviations: X², chi-square statistic; df, degrees of freedom; GFI, goodness of fit index; CFI, comparative fit index; TLI, Tucker-Lewis index; RMSEA, root mean square error of approximation; P, p-value for the chi-square test of invariance; CI, confidence interval.
Convergent validity was assessed using the average variance extracted (AVE) index. An AVE value greater than 0.5 is generally considered acceptable. In the present study, the AVE was estimated to be 0.51. In order to assess Criterion validity of the 7-item ISI, we analyzed the correlation between its total score with other sleep-related scales. The results demonstrate that the relationship between the total score of the ISI with Pittsburgh Sleep Quality Index, show significant correlations, ranging from weak to moderate (r = 0.52 p < 0.01). Internal consistency and composite reliability were used to assess the reliability of the present questionnaire.
Figure 1. The final model
According to the research findings, the composite reliability (CR) was calculated to be 0.865, and the Cronbach's alpha was 0.813. These results indicate that the questionnaire has adequate reliability in the Iranian population. A hierarchical Multiple regression analysis was conducted to examine the contribution of Sleep Quality in predicting sleep-related problems (Table 4). In this investigation, the severity of insomnia was examined as the result variable, with demographic factors and Sleep Quality serving as predictors. The regression analysis was carried out in a two-step process. In the first step age, gender and marital were entered into the model. The results indicated that none of them can significantly predicted insomnia severity. In the second step, age, gender, marital, and Sleep Quality were entered into the model. The results showed that in this step, only Sleep Quality (β = 0.389) significantly predicted insomnia severity. This suggests that for each 0.389 unit rise in PSQI, revealing of poor sleep quality, there is a corresponding one-unit increase in the severity of insomnia. The R2 value for the regression models in the two steps were 0.006 and 0.395, respectively representing that the final model predicts 38.9% of the insomnia severity.
Table 4. Hierarchical regression model of insomnia severity
Abbreviations: R, correlation coefficient; R², coefficient of determination; R² change, change in R² when a new variable is added to the model; B, unstandardized regression coefficient; SE, standard error; β, standardized regression coefficient; t, t-statistic; Sig, Significance level.
Discussion
The aim of the present research was to examine the psychometric characteristics, factorial structure, and measurement invariance of the Insomnia Severity Index (ISI) among Iranian medical sciences students. The ISI demonstrated appropriate internal reliability and convergent validity. The findings suggested that the single-factor model proved to be the most suitable model in the student sample, aligning with previous research outcomes.
The current research demonstrates that clinical insomnia affected 22.6% of male students and 27.9% of female students. This outcome aligns with the findings of the meta-analysis study carried out by Zeng et al. [30], which revealed a higher occurrence of insomnia among female students as compared to male students. The explanations for the higher prevalence of insomnia in women, especially female students, seem to be multifactorial
[30]. In general, women tend to be more exposed to unfavorable socioeconomic conditions, such as acquiring lower income or attaining lower educational levels [31], and therefore female students may experience more stress regarding their future and career. Furthermore, women are more likely to face psychiatric problems like depression and anxiety [32], which serve as risk factors for insomnia in women. As a result, female students experience greater emotional dysfunction and report more insomnia.
Furthermore, the results showed that 62.2% of male students and 67.5% of female students had poor sleep quality. In general, caffeine consumption, stress, and irregular sleep-wake patterns can decrease sleep quality, and mental health issues (such as depression, psychiatric disorders, perceived stress, and anxiety) are undoubtedly detrimental to sleep quality [33]. Given that students may stay up late at night and wake up early due to academic demands and social interactions, and tend to sleep more on holidays, their sleep-wake patterns are irregular. Additionally, due to academic and work-related issues,
students experience high levels of stress. Furthermore, during exam periods, students may increase their caffeine consumption to stay more alert and awake. As a result of all these factors, the sleep quality of students decreases. Moreover, the gender differences in sleep quality problems are mainly attributed to the prioritization of emotional disorders and socioeconomic inequalities [34], which lead to higher levels of experienced stress. The susceptibility of women to poor sleep quality may also stem from gender-based differences in sleep biology, which are exacerbated by the higher levels of emotional disorders in women [35]. Therefore, all of these factors synergistically contribute to a greater reduction in the sleep quality of female students compared to male students.
The findings indicated that the ISI is a reliable instrument for assessing the severity of insomnia in the Iranian medical student population. Specifically, the results demonstrating the good internal consistency of this scale are consistent with the findings from previous research [36]. In this study, three models were tested: one, two, and three-factor model (without item deletion). The results of the CFA indicated that the one-factor model was the most appropriate model for the Iranian medical sciences student population, accounting for 48.10% of the total variance of the questionnaire. This finding is consistent with the results of studies in Sweden [37], and the United States [36], but inconsistent with other studies (11, 38). In explaining this finding, it can be said that in the present study, the two-factor and three-factor models were also fairly suitable, but the one-factor model was the best and most appropriate model for explaining the Insomnia Severity Index in the Iranian medical student population. Additionally, the linguistic and cultural differences between the Iranian population and the populations of other studies can be mentioned.
The measurement invariance implies that the ISI can be utilized in a sufficiently unbiased manner among both male and female respondents. Putnick and Bornstein [39] have suggested that scalar measurement invariance analyses serve as dynamic and informative evaluations of a construct's functioning across groups, rather than serving as gateway tests. These results contribute to the growing body of literature on the psychometric robustness of the ISI and underscore its cross-gender applicability. Furthermore, the results indicated that the Persian version of the ISI (ISI-P) had satisfactory convergent validity (significant positive correlation) with the sleep quality measurement instrument, r = 0.52, p < 0.001. This psychometric property is aligns with the findings of previous studies [17].
The results of the hierarchical regression analysis point to the predictive role of sleep quality in the severity of insomnia (β= 0.389). This indicates that sleep quality accounts for 38.9% of the variance in insomnia severity. The PSQI, used in our study to measure sleep quality, has been widely validated and shown to be effective in assessing various dimensions of sleep quality, including subjective sleep quality, sleep duration, sleep latency, sleep disturbances, habitual sleep efficiency, and daytime dysfunction [23]. Poor scores on these dimensions were significantly correlated with higher ISI scores, indicating more severe insomnia. This is align with previous studies that have found a strong relationship between sleep quality, as measured by the PSQI, and insomnia severity [40].
In examining the broader implications of these findings, it is essential to consider the multifaceted nature of sleep quality and its determinants. Factors such as sleep hygiene, psychological stress, academic workload, and lifestyle habits can significantly influence sleep quality. In other words, practices that compromise good sleep hygiene, such as extensive screen usage before bed, inconsistent sleep schedules, and excessive caffeine intake, can worsen sleep quality and heighten the risk of developing insomnia [41]. Moreover, psychological factors play a critical role in sleep quality. There is a strong connection between stress, anxiety, and depression, as well as poor sleep quality and insomnia. Research has found that people with higher stress levels and negative affect are more prone to experiencing poor sleep quality and, in turn, developing more pronounced insomnia [15]. The interplay between psychological factors and sleep quality suggests that interventions aimed at reducing stress and improving mental health could be effective in mitigating insomnia severity.
This study had a few limitations such as did not controling for medication treatment in the sample data. Future studies can address this factor. The convergent validity of the ISI-P scale was assessed using only one measurement instrument. The study relied on a single source of data (self-report) for evaluating insomnia severity. Future research could consider incorporating additional measures, such as sleep diaries or objective sleep assessments, to provide a more comprehensive evaluation. Despite these limitations, the findings contribute to the growing body of evidence supporting the psychometric properties of the ISI in the Iranian medical student population.
Conclusion
In this study, the cross-cultural adaptation of the Insomnia Severity Index (ISI) was rigorously conducted in accordance with established guidelines, and its factor structure, psychometric properties and measurement invariance were examined in a sample of Iranian medical sciences students. The results of this study strengthen the psychometric validity of the ISI and further reinforce its structural validity. Additionally, the results of the regression analysis showed that sleep quality is the best predictor of insomnia severity. Overall, the findings of this study can facilitate future research and clinical interventions related to the severity of insomnia. However, further studies are needed to deepen our understanding of insomnia severity and its relationship with other variables that impact individual functioning.
Ethical considerations
The Research Ethics Committee of the Zanjan University of Medical Sciences (ZUMS), in Zanjan, Iran approved the study (Approval ID: IR.ZUMS.REC.1402.176). All participants gave written informed consent, and they could withdraw from the study at any stage.
Artificial intelligence utilization for article writing
The authors declare that they did not use generative Artificial Intelligence (AI) and AI-assisted technologies in the writing process of this paper.
Acknowledgments
The authors want to thank all students of Zanjan University of Medical Sciences (Iran) who actively participated in this study.
Conflict of interest statement
The authors have no conflicts of interest to declare
Author contributions
ZNE, AR and OS and designed, conducted the study, performed the statistical analyses, and wrote the manuscript. HTS participated in the design and coordination and helped to draft the manuscript. All authors read and approved the final manuscript
Funding
Zanjan University of Medical Sciences has financially supported this study.
Data availability statement
Data will be made available on request.
Article Type : Orginal Research |
Subject:
Medical Education
Received: 2024/06/15 | Accepted: 2025/02/2 | Published: 2025/04/14
Received: 2024/06/15 | Accepted: 2025/02/2 | Published: 2025/04/14
References
1. Ohayon MM. Epidemiology of insomnia: what we know and what we still need to learn. Sleep Medicine Reviews. 2002;6(2):97-111. [DOI]
2. Ohayon MM, Guilleminault C. Epidemiology of sleep disorders. Sleep: a comprehensive handbook. 2006;73. [DOI]
3. Ibrahim JM, Abouelezz NF. Relationship between insomnia and computer use among students at Ain Shams University, Cairo, Egypt. Egyptian Journal of Community Medicine. 2011;29(2). [DOI]
4. Yassin A, Al Mistarehi AH, Beni Yonis O, Aleshawi AJ, Momany SM, Khassawneh BY. Prevalence of sleep disorders among medical students and their association with poor academic performance: a cross-sectional study. Annals of Medicine and Surgery. 2020;58:124-9. [DOI]
5. Sateia MJ. International classification of sleep disorders-third edition. Chest. 2014;146(5):1387-94. [DOI]
6. Roane BM, Taylor DJ. Adolescent insomnia as a risk factor for early adult depression and substance abuse. Sleep. 2008;31(10):1351-6. [DOI]
7. Curcio G, Ferrara M, De Gennaro L. Sleep loss, learning capacity and academic performance. Sleep Medicine Reviews. 2006;10(5):323-37. [DOI]
8. Vedaa Ø, Erevik EK, Hysing M, Hayley AC, Sivertsen B. Insomnia, sleep duration and academic performance: a national survey of Norwegian college and university students. Sleep Medicine: X. 2019;1:100005. [DOI]
9. Kamdar BB, Kaplan KA, Kezirian EJ, Dement WC. The impact of extended sleep on daytime alertness, vigilance, and mood. Sleep Medicine. 2004;5(5):441-8. [DOI]
10. Azad MC, Fraser K, Rumana N, et al. Sleep disturbances among medical students: a global perspective. Journal of Clinical Sleep Medicine. 2015;11(1):69-74. [DOI]
11. Castronovo V, Galbiati A, Marelli S, et al. Validation study of the Italian version of the insomnia severity index (ISI). Neurological Sciences. 2016;37:1517-24. [DOI]
12. Ruiz C, Guilera G, Gómez-Benito J. Development of a scale to assess the diurnal impact of insomnia. Psychiatry Research. 2011;190(2):335-41 [DOI]
13. Yazdi Z, Sadeghniiat-Haghighi K, Zohal MA, Elmizadeh K. Validity and reliability of the Iranian version of the insomnia severity index. Malaysian Journal of Medical Sciences. 2012;19(4):31-6. [DOI]
14. Omachi TA. Measures of sleep in rheumatologic diseases: Epworth sleepiness scale (ESS), functional outcome of sleep questionnaire (FOSQ), insomnia severity index (ISI), and Pittsburgh sleep quality index (PSQI). Arthritis Care & Research. 2011;63(S11):S287-S96. [DOI]
15. Bastien CH, Vallières A, Morin CM. Validation of the insomnia severity index as an outcome measure for insomnia research. Sleep Medicine. 2001;2(4):297-307 [DOI]
16. Chahoud M, Chahine R, Salameh P, Sauleau EA. Reliability, factor analysis and internal consistency calculation of the insomnia severity index (ISI) in French and in English among Lebanese adolescents. eNeurologicalSci. 2017;7:9-14. [DOI]
17. Fernandez-Mendoza J, Rodriguez-Muñoz A, Vela-Bueno A, et al. The Spanish version of the insomnia severity index: a confirmatory factor analysis. Sleep Medicine. 2012;13(2):207-10. [DOI]
18. Lin RM, Xie SS, Yan WJ, Yan YW. Factor structure and psychometric properties of the insomnia severity index in Mainland China. Social Behavior and Personality: an international journal. 2018;46(2):209-18. [DOI]
19. Farrahi Moghaddam J, Nakhaee N, Sheibani V, Garrusi B, Amirkafi A. Reliability and validity of the Persian version of the Pittsburgh sleep quality index (PSQI-P). Sleep and Breathing. 2012;16(1):79-82. [DOI]
20. Chehri A, Khazaie H, Eskandari S, et al. Validation of the Farsi version of the revised Adolescent Sleep Hygiene Scale (ASHSr): a cross-sectional study. BMC Psychiatry. 2017;17(1):408. [DOI]
21. Anthoine E, Moret L, Regnault A, Sébille V, Hardouin JB. Sample size used to validate a scale: a review of publications on newly-developed patient reported outcomes measures. Health and Quality of Life Outcomes. 2014;12(1):2. [DOI]
22. Manzar MD, Jahrami HA, Bahammam AS. Structural validity of the insomnia severity index: a systematic review and meta-analysis. Sleep Medicine Reviews. 2021;60:101531. [DOI]
23. Mollayeva T, Thurairajah P, Burton K, Mollayeva S, Shapiro CM, Colantonio A. The Pittsburgh sleep quality index as a screening tool for sleep dysfunction in clinical and non-clinical samples: a systematic review and meta-analysis. Sleep Medicine Reviews. 2016;25:52-73. [DOI]
24. Manzar MD, BaHammam AS, Hameed UA, et al. Dimensionality of the Pittsburgh sleep quality index: a systematic review. Health and Quality of Life Outcomes. 2018;16:1-22. [DOI]
25. Shadzi MR, Rahmanian M, Heydari A, Salehi A. Structural validity of the Pittsburgh sleep quality index among medical students in Iran. Scientific Reports. 2024;14(1):1538. [DOI]
26. Beaton DE, Bombardier C, Guillemin F, Ferraz MB. Guidelines for the process of cross-cultural adaptation of self-report measures. Spine. 2000;25(24):3186-91 [DOI]
27. Brislin RW. Back-translation for cross-cultural research. Journal of Cross-Cultural Psychology. 1970;1(3):185-216. [DOI]
28. West SG, Taylor AB, Wu W. Model fit and model selection in structural equation modeling. Handbook of structural equation modeling. 2012;1:209-31. [DOI]
29. Schmitt N, Kuljanin G. Measurement invariance: review of practice and implications. Human Resource Management Review. 2008;18(4):210-22. [DOI]
30. Zeng LN, Zong QQ, Yang Y, et al. Gender difference in the prevalence of insomnia: a meta-analysis of observational studies. Frontiers in Psychiatry. 2020;11:577429. [DOI]
31. Lallukka T, Sares-Jäske L, Kronholm E, et al. Sociodemographic and socioeconomic differences in sleep duration and insomnia-related symptoms in Finnish adults. BMC Public Health. 2012;12:1-22. [DOI]
32. Asher M, Aderka IM. Gender differences in social anxiety disorder. Journal of Clinical Psychology. 2018;74(10):1730-41. [DOI]
33. Lund HG, Reider BD, Whiting AB, Prichard JR. Sleep patterns and predictors of disturbed sleep in a large population of college students. Journal of Adolescent Health. 2010;46(2):124-32. [DOI]
34. Arber S, Bote M, Meadows R. Gender and socio-economic patterning of self-reported sleep problems in Britain. Social Science & Medicine. 2009;68(2):281-9. [DOI]
35. Fatima Y, Najman JM, Al Mamun A. Exploring gender difference in sleep quality of young adults: findings from a large population study. Clinical Medicine and Research. 2016;14(3-4):138-44. [DOI]
36. Kaufmann CN, Orff HJ, Moore RC, Delano-Wood L, Depp CA, Schiehser DM. Psychometric Characteristics of the Insomnia Severity Index in Veterans With History of Traumatic Brain Injury. Behavioral Sleep Medicine. 2019;17(1):12-8. [DOI]
37. Dragioti E, Wiklund T, Alföldi P, Gerdle B. The Swedish version of the Insomnia Severity Index: Factor structure analysis and psychometric properties in chronic pain patients. Scandinavian Journal of Pain. 2015;9(1):22-7. [DOI]
38. Otte JL, Bakoyannis G, Rand KL, et al. Confirmatory factor analysis of the insomnia severity index (ISI) and invariance across race: a pooled analysis of MsFLASH data. Menopause. 2019;26(8):850-5. [DOI]
39. Putnick DL, Bornstein MH. Measurement invariance conventions and reporting: the state of the art and future directions for psychological research. Developmental Review. 2016;41:71-90 [DOI]
40. Backhaus J, Junghanns K, Broocks A, Riemann D, Hohagen F. Test–retest reliability and validity of the Pittsburgh sleep quality index in primary insomnia. Journal of Psychosomatic Research. 2002;53(3):737-40. [DOI]
Send email to the article author
| Rights and permissions | |
 |
This work is licensed under a Creative Commons Attribution-NonCommercial 4.0 International License. |