Sat, Aug 1, 2026
[Archive]
Volume 18, Issue 1 (2025)
J Med Edu Dev 2025, 18(1): 115-122 |
Back to browse issues page


Ethics code: Ref. No. CON/DF/2023/8 20th June 2023
Download citation:
BibTeX | RIS | EndNote | Medlars | ProCite | Reference Manager | RefWorks
Send citation to:


BibTeX | RIS | EndNote | Medlars | ProCite | Reference Manager | RefWorks
Send citation to:
Poorkiani M, Al Salmi N, Alshdefat A, Sheikhalipour Z. Nursing students' perceptions of teaching effectiveness evaluations: A cross-sectional descriptive study. J Med Edu Dev 2025; 18 (1) :115-122
URL: http://edujournal.zums.ac.ir/article-1-2231-en.html
URL: http://edujournal.zums.ac.ir/article-1-2231-en.html

1- Lecturer, Adult Health and Critical Care Department, College of Nursing, Sultan Qaboos University. Muscat, Oman.
2- Department of Adult Health and Critical Care, College of Nursing, Sultan Qaboos University. Muscat, Oman.
3- Department of Medical and Surgical Nursing, College of Nursing, Sultan Qaboos University. Muscat, Oman.
4- Department of Medical and Surgical Nursing, Nursing and Midwifery School, Tabriz University of Medical Sciences. ,sheikhalipourz@gmail.com
2- Department of Adult Health and Critical Care, College of Nursing, Sultan Qaboos University. Muscat, Oman.
3- Department of Medical and Surgical Nursing, College of Nursing, Sultan Qaboos University. Muscat, Oman.
4- Department of Medical and Surgical Nursing, Nursing and Midwifery School, Tabriz University of Medical Sciences. ,
Full-Text [PDF 726 kb]
(780 Downloads)
| Abstract (HTML) (1776 Views)
Full-Text: (434 Views)
Abstract
Background & Objective: While students' perceptions are rarely discussed in studies on student evaluations of teaching effectiveness, the majority concentrate on the features, validity, and reliability of the questionnaire used, the variables affecting students' ratings, and the proper assessment of teaching quality. Therefore, this study aims to look into how students at Sultan Qaboos University's College of Nursing perceive and behave when evaluating the faculty.
Materials & Methods: This cross-sectional descriptive study was carried out in the academic year 2023–2024 during the summer and fall semesters. Two hundred thirty undergraduate students from Sultan Qaboos University's College of Nursing participated in the study. Convenience sampling was employed to gather data. A self-administered questionnaire was used to learn more about the Student Evaluation of Teaching Effectiveness (SETE). SPSS version 29 was used to analyze the data. The sample's demographics and the items about teaching effectiveness were described using frequency analysis. Furthermore, a correlational test was used to find relationships between SETE levels and demographic characteristics.
Results: According to the study, the estimated presence of false information was 47.24%, and the mean perceived accuracy of evaluations was 50.78. A sizable percentage acknowledged providing or being aware of assessments that were either higher or lower than appropriate. There were different opinions about the evaluation process; 84.6% of respondents supported student evaluations, while 55.1% thought teachers read comments. With 76.1% of respondents considering false information to be cheating, ethical issues were raised. Statistical analyses revealed no significant relationships between sex and questionnaire responses, nor between evaluation perceptions, demographic characteristics, and Grade Point Average (GPA).
Conclusion: The results show how complicated student opinions are regarding teacher assessments, particularly when it comes to truth and morality. The study calls for improvements in SETE processes to promote more reliable and reasonable evaluations.
Abbreviations: n, number of participants; SD, standard deviation; GPA, grade point average; %, percentage.

Abbreviations: n, number of participants; SD, standard deviation; GPA, grade point average; %, percentage.
Abbreviations: n, number of participants; SD, standard deviation; GPA, grade point average; %, percentage.
Discussion
This study examines various aspects of student evaluations of instructors, focusing on participants' perceptions, behaviors, and preferences. The GPA of the students involved sheds light on their academic performance. Additionally, with an average age of 21.58 years, a predominance of female students, and a significant representation of students from Semester 7, the participant profile reflects diverse academic backgrounds.
The survey findings reveal differing motivations behind submitting inaccurate comments in evaluations. While a small number of respondents reported malicious intent, a larger group indicated their main motivations were to protect or show appreciation for their instructors. These results highlight the complexity of student perceptions and demonstrate how personal biases and relationships can impact evaluation feedback. According to a study by Carless and Winstone, students may give more favorable feedback because they want to protect their instructors or express their gratitude rather than provide accurate assessments [10]. Furthermore, the study of Esarey and Valdes showed that these biases can lead to both overly optimistic and pessimistic feedback, ultimately affecting the overall validity of evaluations [11].
Most respondents preferred evaluations to take place once per semester, indicating a desire for more consistent feedback mechanisms. This inclination implies that more frequent assessments support ongoing enhancements to the caliber of student instruction and learning outcomes. Nonetheless, a minority of participants advocated for less frequent assessments, indicating the range of viewpoints on this matter. Ethical questions concerning the integrity and authenticity of evaluation feedback are raised by the admission of making false comments, especially to defend or support preferred instructors. The frequency of this behavior emphasizes the necessity of robust evaluation procedures that minimize biases and conflicts of interest while promoting sincere feedback.
Quinn [12] examined the impact of rating biases, such as personal relationships and favoritism, on the accuracy of instructor evaluations. The researchers emphasized the need for mechanisms to address these biases. Furthermore, Kreitzer and Sweet-Cushman's research from 2021 looked at how students' personal biases and instructors' actions can affect the authenticity and caliber of feedback in assessments. This study emphasized the significance of preserving objectivity in the assessment procedure [13].
Respondents expressed average confidence in the evaluations' capacity to accurately reflect instructor performance, indicating a moderate level of perceived accuracy. The significant standard deviation, however, suggests a great deal of variation in perceptions, which are probably impacted by personal experiences or evaluation biases. Additionally, the study discovered that participants thought a significant percentage of assessments might include false or deceptive information. To guarantee the validity and dependability of feedback, this study emphasizes the necessity of robust quality assurance procedures in the assessment. The subjective nature of evaluations and the possibility of bias resulting from interpersonal relationships or motivations are made clear by looking at individual experiences and behaviors related to evaluation feedback. This highlights how crucial it is to encourage accountability and openness in the assessment procedure to reduce potential biases.
Themes about teacher evaluations have been studied in earlier studies. According to Uttl et al., students typically prefer more frequent assessments, indicating a strong desire for consistent feedback [14]. On the other hand, Boysen noted a notable lack of confidence in the validity of assessments, suggesting that opinions may vary depending on the educational setting [15]. Different findings about the frequency of inaccurate information in assessments were reported by Baniasadi et al., highlighting the need for more studies to identify the causes of disparities in student feedback [16]. Furthermore, Clayson estimated that about 30 percent of evaluations contained false information and found that most students were aware of instances where assessments had been fabricated [17]. The validity of student evaluations in enhancing the performance of individual instructors, changing curricula, and creating comparative scales for faculty assessment is called into question by these findings.
Correlation analyses were performed to investigate possible relationships between variables like GPA, questionnaire answers, and demographic characteristics. The absence of statistically significant correlations indicates that there may not be many linear relationships between these variables. The complexity of evaluation results, which are impacted by a number of variables beyond straightforward linear correlations, must be taken into account.
Numerous studies have examined the connection between student grades and SETE. According to most of these studies, higher expected grades and evaluation ratings are positively correlated; students with higher GPAs also typically rate their teachers higher. However, Stroebe et al. discovered that student evaluations were not substantially impacted by teachers' grading practices [18]. Furthermore, other researchers found that students' perceptions of their teachers were not significantly affected by their knowledge of their grades [19, 20].
According to Berezvai et al., an increase of one point in a student's GPA was linked to an increase of 0.2 to 0.4 in the instructor's evaluation score. They also discovered a correlation between GPA and the average Student Evaluation of Teaching (SET) score for instructors [21].
Examining questionnaire responses and gender provides information about possible evaluation-related attitudes and action variations. The absence of significant correlations raises the possibility that attitudes toward evaluation feedback and preferences for evaluation frequency are not primarily influenced by gender.
Chávez and Mitchell found that students' language when evaluating male professors differed significantly from that used for female professors [22]. Additionally, a male instructor who taught the same course received higher ordinal scores than a female instructor, even for questions that were not specific to the instructor.
The current study has various restrictions. First, Sultan Qaboos University nursing students are the only ones included. Second, students from other disciplines should be surveyed for the study. Finally, the results may not represent students' opinions in different university colleges because they are unique to nursing students at Sultan Qaboos University's College of Nursing in Oman.
Conclusion
The study's conclusions help us better understand how students view teacher evaluations and point out important areas where these procedures need to be improved. Addressing ethical issues, enhancing the genuineness of feedback, and adapting assessment techniques to students' varied preferences are all crucial. These actions are essential to maximize the efficiency and equity of teacher evaluation systems. Future studies should examine what influences students' attitudes and actions, how evaluation feedback affects instructional strategies, and how well interventions that enhance evaluation procedures work. Furthermore, longitudinal studies that monitor how students' attitudes and behaviors change over time may provide important new information about how teacher-student feedback interactions are changing.
Ethical considerations
The College of Nursing's ethics committee approved this study (ethical code: Ref. No. CON/DF/2023/8). Furthermore, the Assistant Dean of the College of Nursing's Undergraduate Office approved the data collection. The study's goals were explained in detail to the participants, who were also informed of their freedom to discontinue participation without incurring fees. They were assured that their decision to participate would not affect their academic standing or grades. The study maintained participant anonymity by refraining from collecting personally identifiable information, such as names or identification numbers. This procedure was clearly outlined in the informed consent form. Surveys were conducted using secure, password-protected electronic platforms and only accessible to the Principal Investigator (PI).
Artificial intelligence utilization for article writing
The authors state that artificial intelligence was utilized to paraphrase the paragraphs and edit the article's final version, particularly for English writing.
Acknowledgment
The authors thank the participants for participating sincerely during the research process.
Conflict of interest statement
The authors declare that no financial or other types of conflicts of interest exist.
Author contributions
MPK conceived the study. AA participated in data acquisition and sampling. NAS and ZSh participated in the study's design and performed the statistical analysis. ZSh interpreted the data. MPK obtained ethical clearance and permission to conduct the study. AA performed the tests. ZSh and MPK drafted or revised the article critically for important intellectual content. All authors read and approved the final manuscript.
Funding
Sultan Qaboos University provided financial support for this study.
Data availability statement
Data is available on request due to privacy/ethical restrictions.
Background & Objective: While students' perceptions are rarely discussed in studies on student evaluations of teaching effectiveness, the majority concentrate on the features, validity, and reliability of the questionnaire used, the variables affecting students' ratings, and the proper assessment of teaching quality. Therefore, this study aims to look into how students at Sultan Qaboos University's College of Nursing perceive and behave when evaluating the faculty.
Materials & Methods: This cross-sectional descriptive study was carried out in the academic year 2023–2024 during the summer and fall semesters. Two hundred thirty undergraduate students from Sultan Qaboos University's College of Nursing participated in the study. Convenience sampling was employed to gather data. A self-administered questionnaire was used to learn more about the Student Evaluation of Teaching Effectiveness (SETE). SPSS version 29 was used to analyze the data. The sample's demographics and the items about teaching effectiveness were described using frequency analysis. Furthermore, a correlational test was used to find relationships between SETE levels and demographic characteristics.
Results: According to the study, the estimated presence of false information was 47.24%, and the mean perceived accuracy of evaluations was 50.78. A sizable percentage acknowledged providing or being aware of assessments that were either higher or lower than appropriate. There were different opinions about the evaluation process; 84.6% of respondents supported student evaluations, while 55.1% thought teachers read comments. With 76.1% of respondents considering false information to be cheating, ethical issues were raised. Statistical analyses revealed no significant relationships between sex and questionnaire responses, nor between evaluation perceptions, demographic characteristics, and Grade Point Average (GPA).
Conclusion: The results show how complicated student opinions are regarding teacher assessments, particularly when it comes to truth and morality. The study calls for improvements in SETE processes to promote more reliable and reasonable evaluations.
Introduction
A common approach to ensure student success and satisfaction with their education is to allow them to share their perspectives on their learning experiences [1]. The primary goal of student ratings is to improve the course experience for students and expand the quality of teaching [2].
The Student Evaluation of Teaching Effectiveness (SETE) is an instrument used to measure students' perspectives when evaluating teaching outcomes. For several reasons, proponents of SETE think that student evaluation of instruction is crucial. These assessments guarantee the caliber of instruction at universities, offer a separate way to measure the efficacy of instructors, direct choices about significant curriculum modifications, support faculty professional development, and aid in creating a framework to measure and incentivize successful teaching outcomes [3] more accurately.
As a result, in many universities, these evaluations are the most important and, in many cases, the only measure for quality assurance, evaluating faculty performance, and judging merit pay, tenure, and promotion [1, 4].
However, a literature review has shown that SETEs may need to be more balanced and fully reflective of teaching effectiveness. Biases that may affect how students assess instruction have been found in empirical research, which could produce unreliable findings [5]. As a result, SETEs run the risk of measuring things other than how well students learn. Furthermore, some research indicates that many teachers believe that a number of uncontrollable elements, like the course's structure and section size, may impact how well they teach, which may affect student assessments [6]. Therefore, the evaluations completed by students address only a few aspects of the course and teaching quality [7]. According to a limited number of studies that have surveyed students, the literature supports the significance of professor evaluations. It indicates that students are capable of assessing their professors. However, these studies also demonstrate that students are not overly hopeful about the overall importance that faculty and administrators place on student opinions [8]. Without serious worries about possible repercussions, students are generally willing to participate in assessments and provide feedback [9].
This paradox demonstrates that while students regularly engage with their instructors, making their opinions and evaluations significant and applicable [8], if students are unaware of the importance of their assessment and fill out the forms carelessly and without consideration, this may affect the validity of the SETE [9]. Therefore, it's critical to comprehend how students view the assessment of instructional effectiveness.
SETE studies rarely discuss students' perceptions, which typically concentrate on the features, validity, and reliability of the questionnaire used, factors influencing student ratings, and appropriate assessment of teaching quality. Thus, this study investigates how Sultan Qaboos University's College of Nursing students view teacher evaluations.
Materials & Methods
Design and setting(s)
This cross-sectional descriptive study was conducted during the summer and fall semesters of the 2023-2024 academic year. Undergraduate students from Sultan Qaboos University's College of Nursing participated in the study. To meet the inclusion requirements, participants had to be currently enrolled undergraduate students who had finished at least one semester of nursing school at Sultan Qaboos University. The study did not include officially postponed or enrolled students in the foundation program.
Participants and sampling
The sample included current undergraduate nursing students at Sultan Qaboos University's College of Nursing in Oman. The students were chosen using convenience sampling techniques. Slovin's formula (n = N / (1 + Ne2)), where (N) is the population size and (e) is the margin of error, was used to determine the sample size.
Based on the college's annual active student records, the population was estimated at 450 students. Using a 5% margin of error and a 95% confidence level, the required sample size was determined to be 208 students. To account for potential attrition (estimated at 10%), the adjusted target sample size was increased to 230 participants. Given an anticipated response rate of 50%, all eligible students were invited to participate in the study by completing the questionnaire.
Tools/Instruments
Part 1. Demographic data: Demographic data collected included age, gender, year of study, Grade Point Average (GPA) range, study program, and participation in extracurricular activities.
Part 2. Evaluation of teaching effectiveness: The primary tool was intended to capture students' opinions of Student Evaluation of Teaching Effectiveness. The questionnaire had twenty items, including thirteen Yes/No questions, two items with a linear scale from 10% to 100%, and five multiple-choice questions.
Although self-report questionnaires are standard tools for data collection, they are subject to response bias. To mitigate this, responses were anonymized, and participants were assured that their evaluations would not affect their academic standing or grades.
The validity and reliability of the questionnaire were thoroughly evaluated. Ten knowledgeable faculty members with expertise in educational research were asked for their opinions to assess the validity of the qualitative content. The experts' level of agreement was measured using the Content Validity Index (CVI). Since the Kuder-Richardson-20 (KR-20) formula is suitable for instruments with dichotomous items, it was used for reliability assessment. Reliability was tested with a sample of 30 participants. The CVI and KR-20 reliability results are as follows:
Importance
The CVI values for individual item importance meet the acceptable criterion of 0.80, indicating that the experts consider each item necessary.
Clarity
Every item's CVI value for clarity likewise satisfies the acceptable standard of 0.80, indicating that the items are intelligible and clear.
Suitability
Similarly, every item's suitability CVI value falls within the acceptable range of 0.80, suggesting that the items are appropriate for their intended use.
The Kuder-Richardson-20 (KR-20) formula assesses the internal consistency reliability of scales with dichotomous items. Our scale's KR-20 coefficient value is 0.99.
Data collection methods
The questionnaire was distributed online. Course coordinators for the core courses were contacted to obtain a list of registered students' email addresses. The questionnaire and an informed consent form were sent to the student's emails. The Principal Investigator (PI) also reminded students to complete the survey during class.
Data analysis
Data were analyzed using SPSS/v29 software (SPSS Inc., Chicago, IL, USA). The demographic features of the sample and the items about teaching effectiveness were described using frequency analysis (means, median, percentiles, and standard deviations). Correlational analysis was performed to find correlations between demographic characteristics and SETE levels.
Results
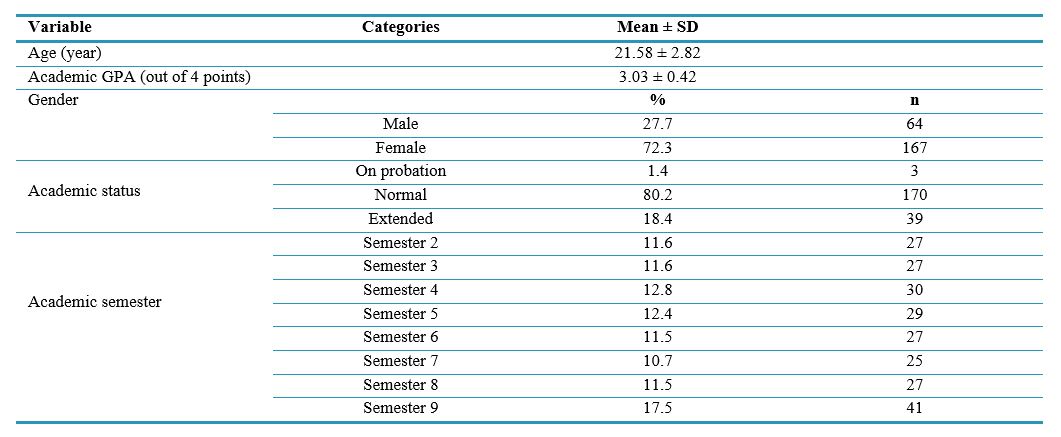
The study disclosed key findings regarding participants' demographics and their opinions regarding teacher evaluations. The average age of participants was 21.58 years (SD = 2.82), and their GPA was 3.03 (SD = 0.42). Most participants (72.3%) were female, and 80.2% had ordinary academic standing. Additionally, 17.5% of participants were in their seventh semester (Table 1).
Table 1. Sociodemographic characteristics of the participants (n = 234).A common approach to ensure student success and satisfaction with their education is to allow them to share their perspectives on their learning experiences [1]. The primary goal of student ratings is to improve the course experience for students and expand the quality of teaching [2].
The Student Evaluation of Teaching Effectiveness (SETE) is an instrument used to measure students' perspectives when evaluating teaching outcomes. For several reasons, proponents of SETE think that student evaluation of instruction is crucial. These assessments guarantee the caliber of instruction at universities, offer a separate way to measure the efficacy of instructors, direct choices about significant curriculum modifications, support faculty professional development, and aid in creating a framework to measure and incentivize successful teaching outcomes [3] more accurately.
As a result, in many universities, these evaluations are the most important and, in many cases, the only measure for quality assurance, evaluating faculty performance, and judging merit pay, tenure, and promotion [1, 4].
However, a literature review has shown that SETEs may need to be more balanced and fully reflective of teaching effectiveness. Biases that may affect how students assess instruction have been found in empirical research, which could produce unreliable findings [5]. As a result, SETEs run the risk of measuring things other than how well students learn. Furthermore, some research indicates that many teachers believe that a number of uncontrollable elements, like the course's structure and section size, may impact how well they teach, which may affect student assessments [6]. Therefore, the evaluations completed by students address only a few aspects of the course and teaching quality [7]. According to a limited number of studies that have surveyed students, the literature supports the significance of professor evaluations. It indicates that students are capable of assessing their professors. However, these studies also demonstrate that students are not overly hopeful about the overall importance that faculty and administrators place on student opinions [8]. Without serious worries about possible repercussions, students are generally willing to participate in assessments and provide feedback [9].
This paradox demonstrates that while students regularly engage with their instructors, making their opinions and evaluations significant and applicable [8], if students are unaware of the importance of their assessment and fill out the forms carelessly and without consideration, this may affect the validity of the SETE [9]. Therefore, it's critical to comprehend how students view the assessment of instructional effectiveness.
SETE studies rarely discuss students' perceptions, which typically concentrate on the features, validity, and reliability of the questionnaire used, factors influencing student ratings, and appropriate assessment of teaching quality. Thus, this study investigates how Sultan Qaboos University's College of Nursing students view teacher evaluations.
Materials & Methods
Design and setting(s)
This cross-sectional descriptive study was conducted during the summer and fall semesters of the 2023-2024 academic year. Undergraduate students from Sultan Qaboos University's College of Nursing participated in the study. To meet the inclusion requirements, participants had to be currently enrolled undergraduate students who had finished at least one semester of nursing school at Sultan Qaboos University. The study did not include officially postponed or enrolled students in the foundation program.
Participants and sampling
The sample included current undergraduate nursing students at Sultan Qaboos University's College of Nursing in Oman. The students were chosen using convenience sampling techniques. Slovin's formula (n = N / (1 + Ne2)), where (N) is the population size and (e) is the margin of error, was used to determine the sample size.
Based on the college's annual active student records, the population was estimated at 450 students. Using a 5% margin of error and a 95% confidence level, the required sample size was determined to be 208 students. To account for potential attrition (estimated at 10%), the adjusted target sample size was increased to 230 participants. Given an anticipated response rate of 50%, all eligible students were invited to participate in the study by completing the questionnaire.
Tools/Instruments
Part 1. Demographic data: Demographic data collected included age, gender, year of study, Grade Point Average (GPA) range, study program, and participation in extracurricular activities.
Part 2. Evaluation of teaching effectiveness: The primary tool was intended to capture students' opinions of Student Evaluation of Teaching Effectiveness. The questionnaire had twenty items, including thirteen Yes/No questions, two items with a linear scale from 10% to 100%, and five multiple-choice questions.
Although self-report questionnaires are standard tools for data collection, they are subject to response bias. To mitigate this, responses were anonymized, and participants were assured that their evaluations would not affect their academic standing or grades.
The validity and reliability of the questionnaire were thoroughly evaluated. Ten knowledgeable faculty members with expertise in educational research were asked for their opinions to assess the validity of the qualitative content. The experts' level of agreement was measured using the Content Validity Index (CVI). Since the Kuder-Richardson-20 (KR-20) formula is suitable for instruments with dichotomous items, it was used for reliability assessment. Reliability was tested with a sample of 30 participants. The CVI and KR-20 reliability results are as follows:
Importance
The CVI values for individual item importance meet the acceptable criterion of 0.80, indicating that the experts consider each item necessary.
Clarity
Every item's CVI value for clarity likewise satisfies the acceptable standard of 0.80, indicating that the items are intelligible and clear.
Suitability
Similarly, every item's suitability CVI value falls within the acceptable range of 0.80, suggesting that the items are appropriate for their intended use.
The Kuder-Richardson-20 (KR-20) formula assesses the internal consistency reliability of scales with dichotomous items. Our scale's KR-20 coefficient value is 0.99.
Data collection methods
The questionnaire was distributed online. Course coordinators for the core courses were contacted to obtain a list of registered students' email addresses. The questionnaire and an informed consent form were sent to the student's emails. The Principal Investigator (PI) also reminded students to complete the survey during class.
Data analysis
Data were analyzed using SPSS/v29 software (SPSS Inc., Chicago, IL, USA). The demographic features of the sample and the items about teaching effectiveness were described using frequency analysis (means, median, percentiles, and standard deviations). Correlational analysis was performed to find correlations between demographic characteristics and SETE levels.
Results
The study disclosed key findings regarding participants' demographics and their opinions regarding teacher evaluations. The average age of participants was 21.58 years (SD = 2.82), and their GPA was 3.03 (SD = 0.42). Most participants (72.3%) were female, and 80.2% had ordinary academic standing. Additionally, 17.5% of participants were in their seventh semester (Table 1).
Abbreviations: n, number of participants; SD, standard deviation; GPA, grade point average; %, percentage.
The survey responses shed light on reasons for writing untrue comments in evaluations (Table 2). A small percentage of respondents (0.4% and 0.9%) reported knowing someone who wrote false comments to harm or because they disliked a teacher. In contrast, 22.7% and 20.5% indicated knowing someone who wrote false comments to protect a teacher or because of personal liking. Regarding the frequency of teacher evaluations, 17.5% of respondents preferred evaluations for every class each semester, whereas 67.9% preferred evaluations once per semester. Just 9.0% of respondents supported less frequent evaluations, like annual ones. In comparison, smaller percentages suggested evaluations only when issues arise (3.4%) or never (2.1%). Notably, none of the participants favored three-year evaluations.
Additionally, participants talked about their personal experiences of posting false comments (Table 2). A sizable portion acknowledged that they had made false remarks because they liked the teacher (50.9%) or to defend the teacher (42.3%). Fewer respondents believed they had written derogatory comments about a teacher because they didn't like them (50.9%) or to hurt the teacher (9.8%).
Table 2. Students' perspectives and behaviors related to writing untrue comments in evaluations and their opinions on teacher evaluation frequencyAdditionally, participants talked about their personal experiences of posting false comments (Table 2). A sizable portion acknowledged that they had made false remarks because they liked the teacher (50.9%) or to defend the teacher (42.3%). Fewer respondents believed they had written derogatory comments about a teacher because they didn't like them (50.9%) or to hurt the teacher (9.8%).
Abbreviations: n, number of participants; SD, standard deviation; GPA, grade point average; %, percentage.
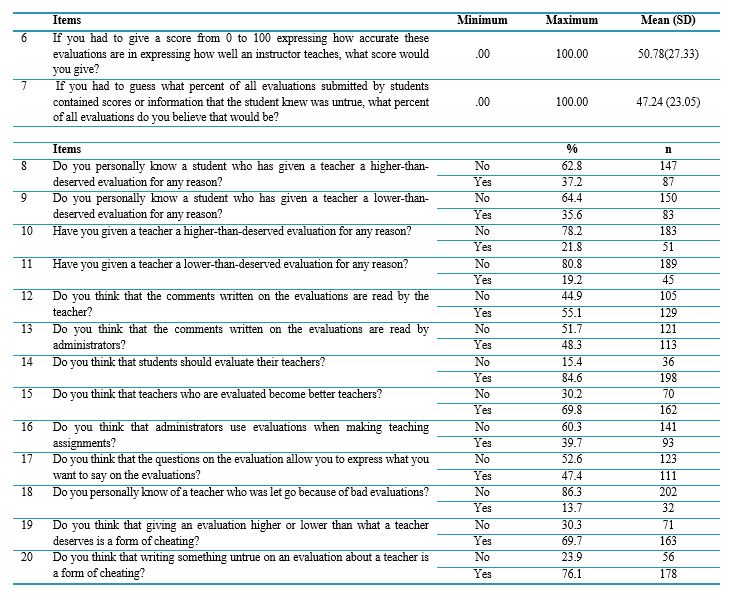
Table 3 summarizes opinions regarding the integrity and correctness of assessments. On a scale of 0 to 100, respondents gave assessments an average perceived accuracy of 50.78 (SD = 27.33), indicating a moderate confidence level in their dependability.
They estimated that, on average, 47.24% of evaluations contained false information (SD = 23.05). A notable proportion of participants reported knowing students who gave evaluations higher than deserved (37.2%) or lower than deserved (35.6%). Additionally, 21.8% admitted to inflating evaluation scores, while 19.2% admitted to giving undeservedly low scores.
The assessment procedure itself uncovered conflicting opinions. While 48.3% of respondents thought administrators reviewed evaluation comments, the majority (55.1%) thought teachers read them. Most respondents (84.6%) favored student assessments of teachers, and 69.8% believed these assessments could aid in teachers' development. There appears to be a gap between the administrative use of evaluations and their perceived value, as only 39.7% of respondents favored using them to decide on teaching assignments. The results show the potential for survey design improvement to better capture student feedback, even though 52.6% of respondents felt the evaluation questions allowed them to express their genuine opinions.
There were also apparent ethical issues. Just 13.7% of respondents said they knew of a teacher who was fired for receiving subpar reviews. Meanwhile, 76.1% of respondents thought it was cheating to write false information in evaluations, and 69.7% thought it was cheating to give unjustly high or low scores. These findings highlight the ethical implications of inaccurate feedback and its potential consequences for teachers.
Statistical analyses (Table 3) showed no significant correlations between demographic factors—such as GPA, academic status, and class standing—and perceptions of evaluation accuracy or false information. For instance, GPA had a weak negative correlation with evaluation accuracy (r = -0.031, p = 0.749) and a weak positive correlation with false information (r = 0.013, p = 0.891). Similarly, chi-square tests found no significant association between sex and responses to questionnaire items (p > 0.05).
Table 3: The students’ insights into the perceived accuracy of evaluations in assessing instructor teaching performanceThey estimated that, on average, 47.24% of evaluations contained false information (SD = 23.05). A notable proportion of participants reported knowing students who gave evaluations higher than deserved (37.2%) or lower than deserved (35.6%). Additionally, 21.8% admitted to inflating evaluation scores, while 19.2% admitted to giving undeservedly low scores.
The assessment procedure itself uncovered conflicting opinions. While 48.3% of respondents thought administrators reviewed evaluation comments, the majority (55.1%) thought teachers read them. Most respondents (84.6%) favored student assessments of teachers, and 69.8% believed these assessments could aid in teachers' development. There appears to be a gap between the administrative use of evaluations and their perceived value, as only 39.7% of respondents favored using them to decide on teaching assignments. The results show the potential for survey design improvement to better capture student feedback, even though 52.6% of respondents felt the evaluation questions allowed them to express their genuine opinions.
There were also apparent ethical issues. Just 13.7% of respondents said they knew of a teacher who was fired for receiving subpar reviews. Meanwhile, 76.1% of respondents thought it was cheating to write false information in evaluations, and 69.7% thought it was cheating to give unjustly high or low scores. These findings highlight the ethical implications of inaccurate feedback and its potential consequences for teachers.
Statistical analyses (Table 3) showed no significant correlations between demographic factors—such as GPA, academic status, and class standing—and perceptions of evaluation accuracy or false information. For instance, GPA had a weak negative correlation with evaluation accuracy (r = -0.031, p = 0.749) and a weak positive correlation with false information (r = 0.013, p = 0.891). Similarly, chi-square tests found no significant association between sex and responses to questionnaire items (p > 0.05).
Abbreviations: n, number of participants; SD, standard deviation; GPA, grade point average; %, percentage.
Discussion
This study examines various aspects of student evaluations of instructors, focusing on participants' perceptions, behaviors, and preferences. The GPA of the students involved sheds light on their academic performance. Additionally, with an average age of 21.58 years, a predominance of female students, and a significant representation of students from Semester 7, the participant profile reflects diverse academic backgrounds.
The survey findings reveal differing motivations behind submitting inaccurate comments in evaluations. While a small number of respondents reported malicious intent, a larger group indicated their main motivations were to protect or show appreciation for their instructors. These results highlight the complexity of student perceptions and demonstrate how personal biases and relationships can impact evaluation feedback. According to a study by Carless and Winstone, students may give more favorable feedback because they want to protect their instructors or express their gratitude rather than provide accurate assessments [10]. Furthermore, the study of Esarey and Valdes showed that these biases can lead to both overly optimistic and pessimistic feedback, ultimately affecting the overall validity of evaluations [11].
Most respondents preferred evaluations to take place once per semester, indicating a desire for more consistent feedback mechanisms. This inclination implies that more frequent assessments support ongoing enhancements to the caliber of student instruction and learning outcomes. Nonetheless, a minority of participants advocated for less frequent assessments, indicating the range of viewpoints on this matter. Ethical questions concerning the integrity and authenticity of evaluation feedback are raised by the admission of making false comments, especially to defend or support preferred instructors. The frequency of this behavior emphasizes the necessity of robust evaluation procedures that minimize biases and conflicts of interest while promoting sincere feedback.
Quinn [12] examined the impact of rating biases, such as personal relationships and favoritism, on the accuracy of instructor evaluations. The researchers emphasized the need for mechanisms to address these biases. Furthermore, Kreitzer and Sweet-Cushman's research from 2021 looked at how students' personal biases and instructors' actions can affect the authenticity and caliber of feedback in assessments. This study emphasized the significance of preserving objectivity in the assessment procedure [13].
Respondents expressed average confidence in the evaluations' capacity to accurately reflect instructor performance, indicating a moderate level of perceived accuracy. The significant standard deviation, however, suggests a great deal of variation in perceptions, which are probably impacted by personal experiences or evaluation biases. Additionally, the study discovered that participants thought a significant percentage of assessments might include false or deceptive information. To guarantee the validity and dependability of feedback, this study emphasizes the necessity of robust quality assurance procedures in the assessment. The subjective nature of evaluations and the possibility of bias resulting from interpersonal relationships or motivations are made clear by looking at individual experiences and behaviors related to evaluation feedback. This highlights how crucial it is to encourage accountability and openness in the assessment procedure to reduce potential biases.
Themes about teacher evaluations have been studied in earlier studies. According to Uttl et al., students typically prefer more frequent assessments, indicating a strong desire for consistent feedback [14]. On the other hand, Boysen noted a notable lack of confidence in the validity of assessments, suggesting that opinions may vary depending on the educational setting [15]. Different findings about the frequency of inaccurate information in assessments were reported by Baniasadi et al., highlighting the need for more studies to identify the causes of disparities in student feedback [16]. Furthermore, Clayson estimated that about 30 percent of evaluations contained false information and found that most students were aware of instances where assessments had been fabricated [17]. The validity of student evaluations in enhancing the performance of individual instructors, changing curricula, and creating comparative scales for faculty assessment is called into question by these findings.
Correlation analyses were performed to investigate possible relationships between variables like GPA, questionnaire answers, and demographic characteristics. The absence of statistically significant correlations indicates that there may not be many linear relationships between these variables. The complexity of evaluation results, which are impacted by a number of variables beyond straightforward linear correlations, must be taken into account.
Numerous studies have examined the connection between student grades and SETE. According to most of these studies, higher expected grades and evaluation ratings are positively correlated; students with higher GPAs also typically rate their teachers higher. However, Stroebe et al. discovered that student evaluations were not substantially impacted by teachers' grading practices [18]. Furthermore, other researchers found that students' perceptions of their teachers were not significantly affected by their knowledge of their grades [19, 20].
According to Berezvai et al., an increase of one point in a student's GPA was linked to an increase of 0.2 to 0.4 in the instructor's evaluation score. They also discovered a correlation between GPA and the average Student Evaluation of Teaching (SET) score for instructors [21].
Examining questionnaire responses and gender provides information about possible evaluation-related attitudes and action variations. The absence of significant correlations raises the possibility that attitudes toward evaluation feedback and preferences for evaluation frequency are not primarily influenced by gender.
Chávez and Mitchell found that students' language when evaluating male professors differed significantly from that used for female professors [22]. Additionally, a male instructor who taught the same course received higher ordinal scores than a female instructor, even for questions that were not specific to the instructor.
The current study has various restrictions. First, Sultan Qaboos University nursing students are the only ones included. Second, students from other disciplines should be surveyed for the study. Finally, the results may not represent students' opinions in different university colleges because they are unique to nursing students at Sultan Qaboos University's College of Nursing in Oman.
Conclusion
The study's conclusions help us better understand how students view teacher evaluations and point out important areas where these procedures need to be improved. Addressing ethical issues, enhancing the genuineness of feedback, and adapting assessment techniques to students' varied preferences are all crucial. These actions are essential to maximize the efficiency and equity of teacher evaluation systems. Future studies should examine what influences students' attitudes and actions, how evaluation feedback affects instructional strategies, and how well interventions that enhance evaluation procedures work. Furthermore, longitudinal studies that monitor how students' attitudes and behaviors change over time may provide important new information about how teacher-student feedback interactions are changing.
Ethical considerations
The College of Nursing's ethics committee approved this study (ethical code: Ref. No. CON/DF/2023/8). Furthermore, the Assistant Dean of the College of Nursing's Undergraduate Office approved the data collection. The study's goals were explained in detail to the participants, who were also informed of their freedom to discontinue participation without incurring fees. They were assured that their decision to participate would not affect their academic standing or grades. The study maintained participant anonymity by refraining from collecting personally identifiable information, such as names or identification numbers. This procedure was clearly outlined in the informed consent form. Surveys were conducted using secure, password-protected electronic platforms and only accessible to the Principal Investigator (PI).
Artificial intelligence utilization for article writing
The authors state that artificial intelligence was utilized to paraphrase the paragraphs and edit the article's final version, particularly for English writing.
Acknowledgment
The authors thank the participants for participating sincerely during the research process.
Conflict of interest statement
The authors declare that no financial or other types of conflicts of interest exist.
Author contributions
MPK conceived the study. AA participated in data acquisition and sampling. NAS and ZSh participated in the study's design and performed the statistical analysis. ZSh interpreted the data. MPK obtained ethical clearance and permission to conduct the study. AA performed the tests. ZSh and MPK drafted or revised the article critically for important intellectual content. All authors read and approved the final manuscript.
Funding
Sultan Qaboos University provided financial support for this study.
Data availability statement
Data is available on request due to privacy/ethical restrictions.
Article Type : Orginal Research |
Subject:
Medical Education
Received: 2024/07/24 | Accepted: 2025/02/5 | Published: 2025/04/14
Received: 2024/07/24 | Accepted: 2025/02/5 | Published: 2025/04/14
References
1. Larry Crumbley D, Reichelt KJ. Teaching effectiveness, impression management, and dysfunctional behavior: Student evaluation of teaching control data. Quality Assurance in Education. 2009;17(4):377-92. [DOI]
2. Oermann MH, Conklin JL, Rushton S, Bush MA. Student evaluations of teaching (SET): guidelines for their use. Nursing Forum. 2018;53(3):280-285. [DOI]
3. Spencer KJ, Schmelkin LP. Student perspectives on teaching and its evaluation. Assessment & Evaluation in Higher Education. 2002;27(5):397-409 [DOI]
4. Otani K, Kim BJ, Cho JI. Student evaluation of teaching (SET) in higher education: how to use SET more effectively and efficiently in public affairs education. Journal of Public Affairs Education. 2012;18(3):531-44. [DOI]
5. Jones J, Gaffney-Rhys R, Jones E. Handle with care! An exploration of the potential risks associated with the publication and summative usage of student evaluation of teaching (SET) results. Journal of Further and Higher Education. 2014;38(1):37-56 [DOI]
6. Mohammed TA, Pandhiani SM. Analysis of factors affecting student evaluation of teaching effectiveness in Saudi higher education: the case of Jubail University College. American Journal of Educational Research. 2017;5(5):464-75. [DOI]
7. Uttl B, White CA, Gonzalez DW. Meta-analysis of faculty's teaching effectiveness: student evaluation of teaching ratings and student learning are not related. Studies in Educational Evaluation. 2017;54:22-42. [DOI]
8. Vilchez JA, Kruse J, Puffer M, Dudovitz RN. Teachers and school health leaders' perspectives on distance learning physical education during the COVID‐19 pandemic. Journal of School Health. 2021;91(7):541-9. [DOI]
9. Paufler NA, Sloat EF. Using standards to evaluate accountability policy in context: school administrator and teacher perceptions of a teacher evaluation system. Studies in Educational Evaluation. 2020;64:100806. [DOI]
10. Carless D, Winstone N. Teacher feedback literacy and its interplay with student feedback literacy. Teaching in Higher Education. 2023;28(1):150-63. [DOI]
11. Esarey J, Valdes N. Unbiased, reliable, and valid student evaluations can still be unfair. Assessment & Evaluation in Higher Education. 2020;45(8):1106-20 [DOI]
12. Quinn DM. Experimental evidence on teachers’ racial bias in student evaluation: the role of grading scales. Educational Evaluation and Policy Analysis. 2020;42(3):375-92 [DOI]
13. Kreitzer RJ, Sweet-Cushman J. Evaluating student evaluations of teaching: a review of measurement and equity bias in SETs and recommendations for ethical reform. Journal of Academic Ethics. 2021;20(3–4):1–12. [DOI]
14. Rollett W, Bijlsma H, Röhl S. Student feedback on teaching in schools: using student perceptions for the development of teaching and teachers. Springer, Cham. 2021: 237-56. [DOI]
15. Boysen GA. The multidimensional nature of teaching and student evaluations: commentary on students' judgments of learning and teaching effectiveness. Journal of Applied Research in Memory and Cognition. 2020:9(2);152–156.
Boysen GA. The multidimensional nature of teaching and student evaluations: commentary on students' judgments of learning and teaching effectiveness. Journal of Applied Research in Memory and Cognition. 2020:9(2);152–156. [DOI]
16. Baniasadi A, Salehi K, Khodaie E, Bagheri Noaparast K, Izanloo B. Fairness in classroom assessment: a systematic review. The Asia-Pacific Education Researcher. 2022:1-9 [DOI]
17. Clayson DE. A comprehensive critique of student evaluation of teaching: Critical perspectives on validity, reliability, and impartiality. Routledge; 2020. [DOI]
18. Stroebe W. Student evaluations of teaching encourage poor teaching and contribute to grade inflation: a theoretical and empirical analysis. Basic and Applied Social Psychology. 2020;42(4):276-94. [DOI]
19. Carpenter SK, Witherby AE, Tauber SK. On students'(mis) judgments of learning and teaching effectiveness. Journal of Applied Research in Memory and Cognition. 2020;9(2):137-51 [DOI]
20. Chamberlin K, Yasué M, Chiang I-CA. The impact of grades on student motivation. Active Learning in Higher Education. 2023;24(2):109-24. [DOI]
21. Berezvai Z, Lukáts GD, Molontay R. Can professors buy better evaluation with lenient grading? The effect of grade inflation on student evaluation of teaching. Assessment & Evaluation in Higher Education. 2021;46(5):793-808. [DOI]
22. Chávez K, Mitchell KM. Exploring bias in student evaluations: gender, race, and ethnicity. Political Science & Politics. 2020;53(2):270-4. [DOI]
Send email to the article author
| Rights and permissions | |
 |
This work is licensed under a Creative Commons Attribution-NonCommercial 4.0 International License. |